
Migrating from a Monolith to Microservices: A Step-by-Step Guide
This article is a step-by-step guide on how to migrate from a Monolith to Microservices

Containers are widely used today from development to production. However, a docker stats in ssh does not allow you to correctly assess your production environment. We will therefore see how to meet this monitoring need for containers in production.
We will discuss several technologies to meet this need:
Resource: ctop allows you to view
docker statsinfo inhtopstyle.
The stack that we are going to see works like this:
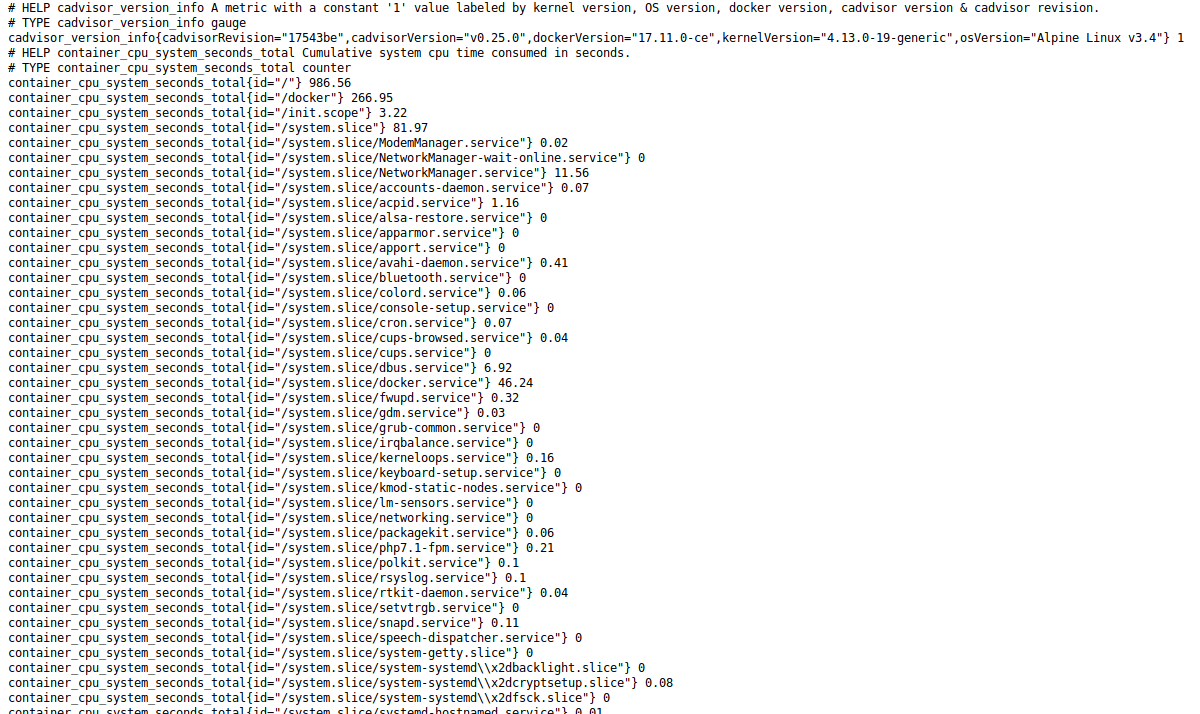
cAdvisor will expose the http://cadvisor:8080/metrics endpoint with all the metrics of the containers at a given time t.
Prometheus will query every x seconds the endpoint from cAdvisor and store metrics in its database.
Grafana will display metrics from Prometheus in the form of graphs.
Before you begin, make sure you have docker and docker-compose installed. My versions for writing this article are:
> $ docker --version; docker-compose --version
Docker version 17.11.0-ce, build 1caf76c
docker-compose version 1.17.1, build 6d101fb
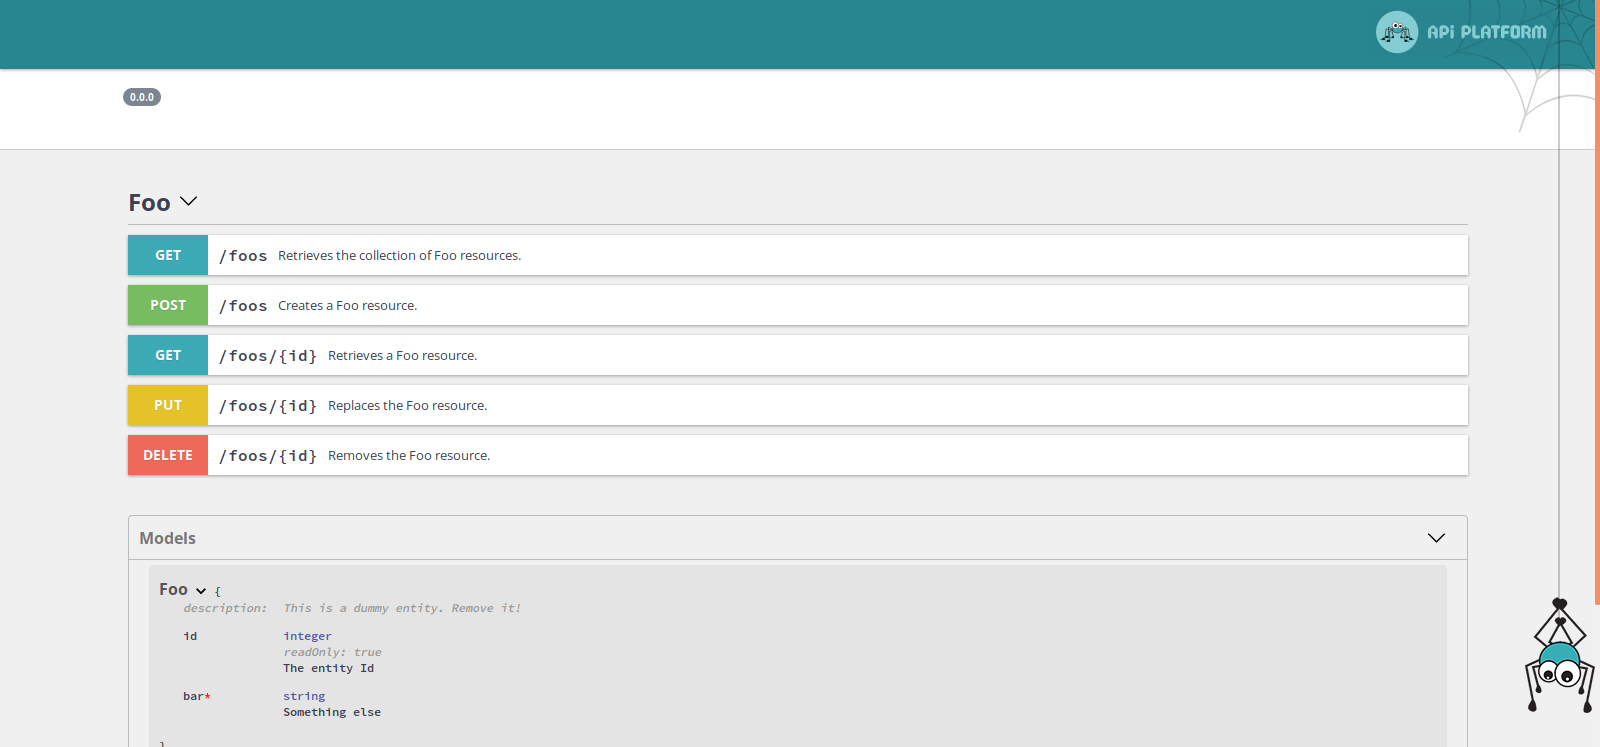
For starters, we're going to quickly install an app, take for example Api Platform.
> $ git clone git@github.com:api-platform/api-platform.git
> $ cd api-platform
> $ git checkout v2.1.4
> $ docker-compose up
> $ open http://127.0.0.1
We now have access to the documentation for the API you just installed.
We are going to add cAdvisor to docker-compose.yml:
Resource: you can find
docker-compose.ymlandprometheus.ymlfiles here.
services:
...
  cadvisor:
    image: google/cadvisor
    container_name: cadvisor
    volumes:
      - /:/rootfs:ro
      - /var/run:/var/run:rw
      - /sys:/sys:ro
      - /var/lib/docker/:/var/lib/docker:ro
    expose:
      - 8080
    ports:
      - "8005:8080"
    networks:
      - monitoring

networks:
  monitoring:
    driver: bridge
Let's restart docker-compose.
> $ docker-compose build
> $ docker-compose up
> $ open http://localhost:8005/docker/
We can now access cAdvisor's interface.
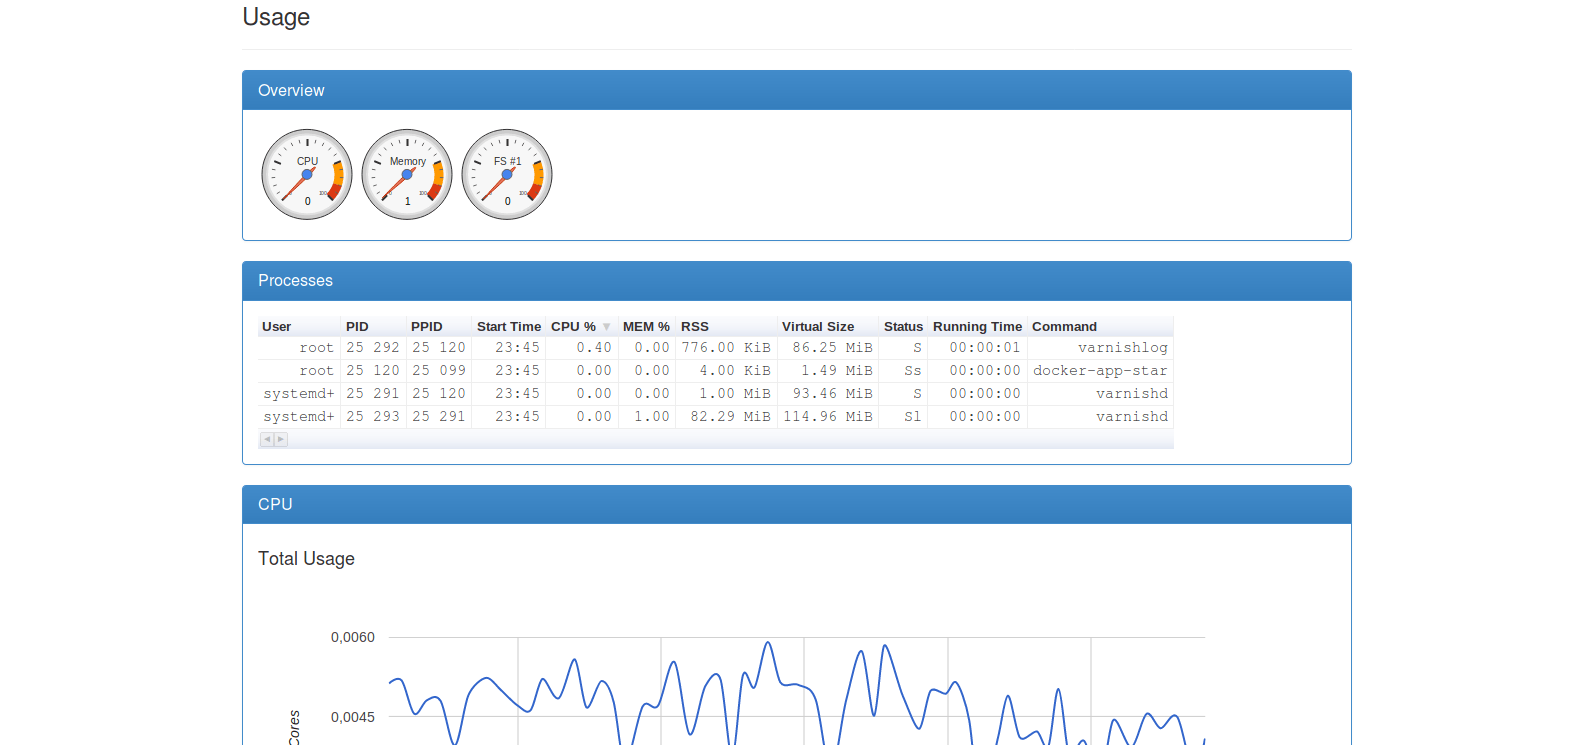
This already allows us to see briefly the metrics of our containers.
However, this solution alone is not configurable enough and cannot fully meet our needs.
Let's begin by installing Prometheus:
services:
...
  prometheus:
    image: prom/prometheus:v2.0.0
    container_name: prometheus
    volumes:
    - ./docker/prometheus/:/etc/prometheus/
    - prometheus-data:/prometheus
    command:
    - '--config.file=/etc/prometheus/prometheus.yml'
    - '--storage.tsdb.path=/prometheus'
    - '--web.console.libraries=/etc/prometheus/console_libraries'
    - '--web.console.templates=/etc/prometheus/consoles'
    - '--storage.tsdb.retention=200h'
    expose:
    - 9090
    ports:
    - "9090:9090"
    networks:
    - monitoring

volumes:
...
  prometheus-data: {}
And let's add the configuration file prometheus.yml into the docker/prometheus folder.
global:
  scrape_interval: 15s
  evaluation_interval: 15s
  external_labels:
    monitor: 'docker-host-alpha'

rule_files:
  - "targets.rules"
  - "host.rules"
  - "containers.rules"

scrape_configs:
  - job_name: 'cadvisor'
    scrape_interval: 5s
    static_configs:
      - targets: ['cadvisor:8080']

  - job_name: 'prometheus'
    scrape_interval: 10s
    static_configs:
      - targets: ['localhost:9090']
We can notice the cadvisor scraping job on the cadvisor: 8080 endpoint. Prometheus will always scrape according to the following scheme:
<host>:<port>/metrics
For configuration, the /metrics is implied.
We can restart docker-compose again.
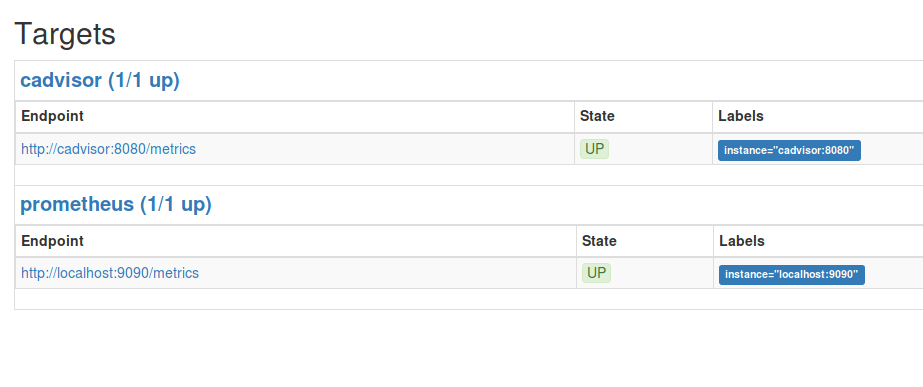
> $ docker-compose build
> $ docker-compose up
> $ open http://localhost:9090/targets
We can see that the jobs we configured are up. That is to say that Prometheus has managed to scrape the metrics from cAdvisor and Prometheus.
We are going to install Grafana now:
services:
...
  grafana:
    image: grafana/grafana:4.6.2
    container_name: grafana
    volumes:
      - grafana-data:/var/lib/grafana
    expose:
      - 3000
    ports:
      - "3000:3000"
    networks:
      - monitoring

volumes:
...
  grafana-data: {}
Let's restart docker-compose one last time.
> $ docker-compose build
> $ docker-compose up
> $ open http://localhost:3000
Access: Default access codes for Grafana are admin admin
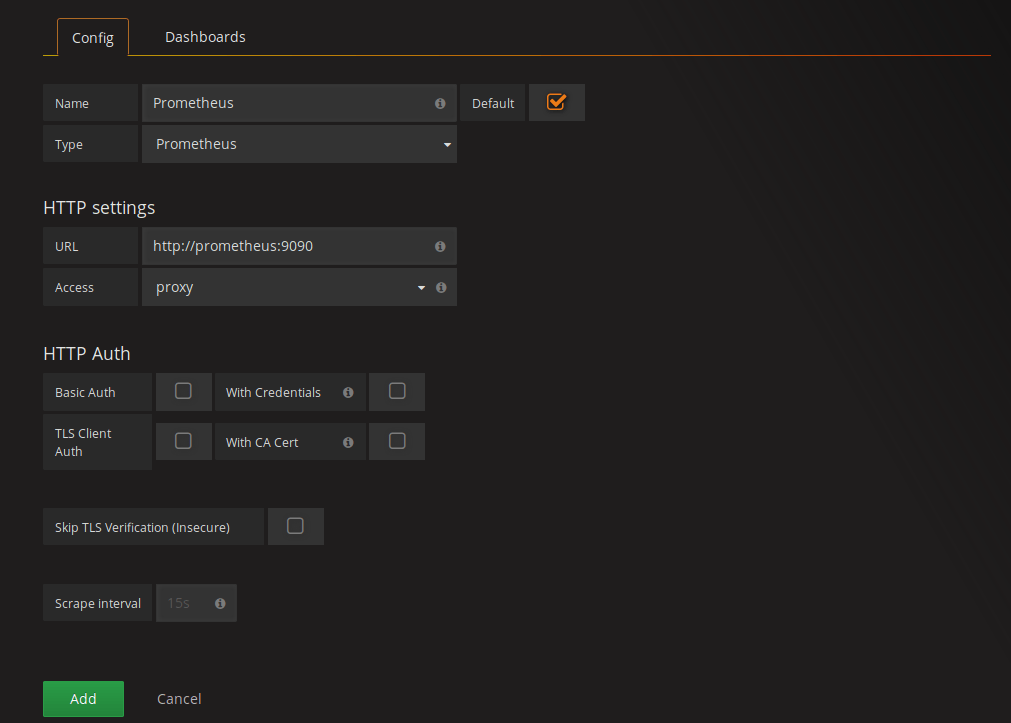
Let's start by adding our Prometheus as Data Sources. Let's go to http://localhost:3000/datasources/new and add the host of our Prometheus.
Now that Grafana can access our Prometheus all we have to do is create a new dashboard. To save time we will import it directly.
Let's import this new dashboard http://localhost:3000/dashboard/new?editview=import∨gId=1 and put the template id 193. Once done, we can go to our dashboard.
http://localhost:3000/dashboard/db/docker-monitoring?refresh=10s∨gId=1
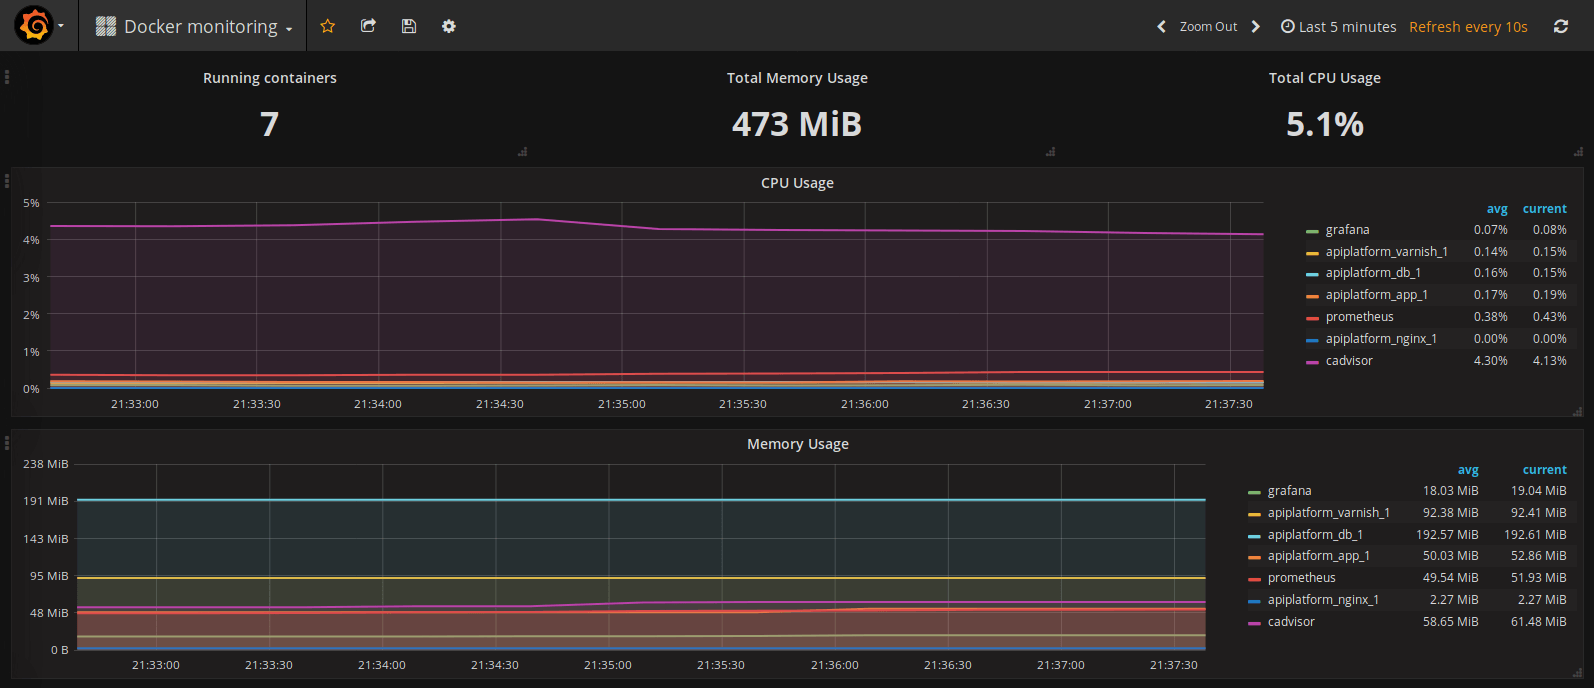
We can now see the system metrics of our containers, like the consumption cpu or ram for each of them.
Depending on your needs, you can create more specific dashboards with the information you need.
For Prometheus, there are many exporters to be able to retrieve even more metrics like for example for Redis or RabbitMQ.
You can also create an exporter yourself as long as it exposes metrics on an HTTP /metrics endpoint or even exposes business metrics from your application.
Resource: you can find the business metrics exposure in a Java application, as explained in this article http://blog.xebia.fr/2017/07/28/superviser-mon-application-play-avec-prometheus
Author(s)
Quentin Neyrat
Back-end developer @ Eleven Labs
Marie Minasyan
Astronaute Raccoon @ ElevenLabs_🚀 De retour dans la Galaxie.
You wanna know more about something in particular?
Let's plan a meeting!
Our experts answer all your questions.
Contact usDiscover other content about the same topic
This article is a step-by-step guide on how to migrate from a Monolith to Microservices

You work with Symfony, but the concept of dependency injection is a little blurry for you? Find out how to take advantage of the component reading this article.

Today is the International Women's Rights Day, and we wanted to take the opportunity to talk to you about a subject that is close to our hearts: women in IT. The purpose of this article is to tell you about our experience to give you a better vision of why there aren't many of us, why some give up, and, above all, how to make that change.